Mapping my Facebook Messenger Network
I am currently going through my personal data downloaded from Facebook to better understand my digital footprint and what Facebook knows about me. The Messenger data is an amazing source for text analysis but there is also a wealth of metadata that can be analysed:. here, I look at conversaton participants and I use social network analysis to explore my communication network on Messenger.
I hope to answer questions like: how dense is my friendship network? Who are my most central friends? Did I do a good job at connecting my friends and integrating my social life? And much more.
The data
I downloaded my Facebook data a while ago and only requested a few month to minimize the wait and size of the file. The folder contains all my Facebook activity including my messages with some very convenient metadata. For this project, I only use this metadata of the messages: the conversation members. Participants in the group chats - my connections on Messenger - will be the nodes, and an edge between two connections (including myself) is the result of being members of the same group chat. For, instance from my private chat with Pauline, there is an edge (Alix, Pauline) and from a group what what Max, Pauline and I there are three edges (Alix, Pauline), (Pauline, Max), (Alix Max). This is an undirected network.
Methods
Pre-processing steps
I processed the data in Python. The original data I got from Facebook was a folder /messages/inbox which contains as many folders as conversations I have - both private conversations and group chats. Each folder contains a .json file which lists the members of the conversation, and for each message in the chat, the sender, timestamp and content. I used a loop to open all the folders, fetch the .json content and appended all the conversations to a single object. From this, I extracted all the conversation participants (my nodes) and whenever two people appear in a conversation, their two names form a tuple (my edges). Finally, I generate the edge weight by computing the frequency table of the edges. For instance if (Alix, Max) appears 5 times, I get a list made of a tupe (the edge) and a numerical (the weight) [(Alix, Max), 5]. The next step was to use the networkX module in Python to add each edge and their weight to a graph object and export the object as a .json file which already has the right format for plotting using the D3.js wrapper function forceNetwork() in R. To conduct some further analysis, I create an igraph object to compute some simple network statistics.
Analysis and visualisation
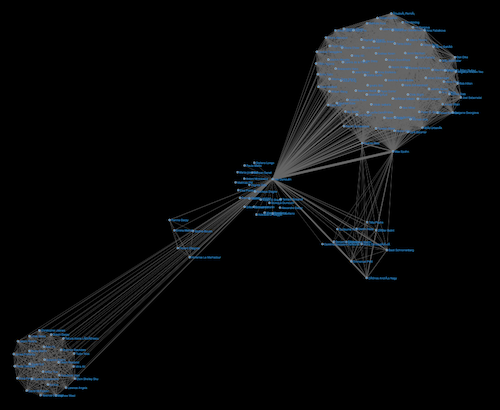
I first use R’s igraph library to plot the network and conduct some analysis, in particular to find out more about density, transitivity as well as to apply a community detection algorithm. Because it is difficult to distinguish the labels for a network of this size, I switched to the D3.js plotting library.
Findings
Here is my network
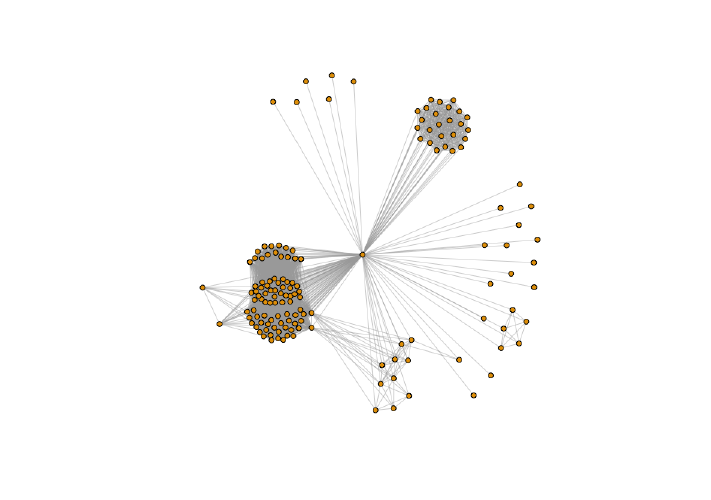
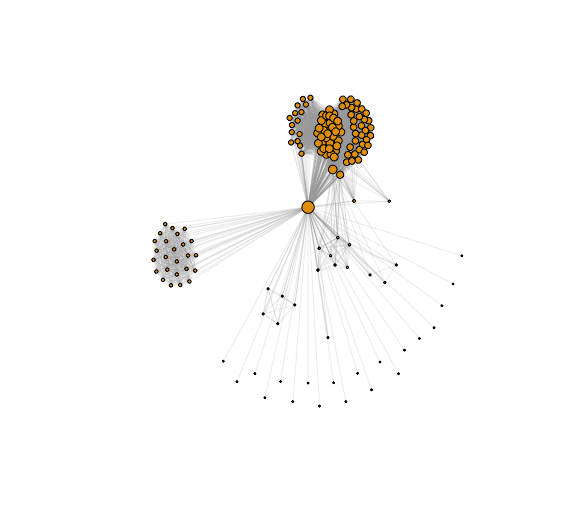
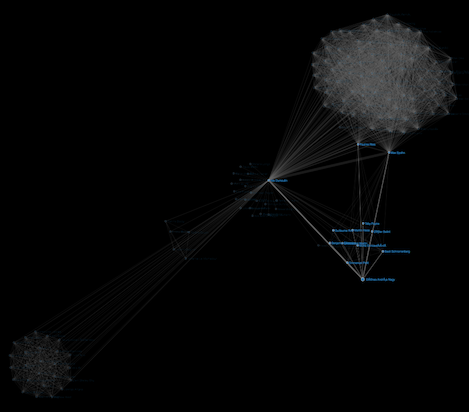
This is what the network looks like. The .html version of the graph allows you to zoom in and out to explore the relationships from closer, but to respect the privacy of my connections, I will only share some screenshots where the labels are not visible.
The size of the vertices is not weighted but the edges are weighted by the number of conversations people in my network (including myself) have in common. It is quite interesting because not only can I see who I am directly connected with but also independently of me, I can see that some of my friends are in many similar group chats. The weight of the edges is a very good representation of how close I am to people, no surprises here.
The graph shows some clear clusters: a large group on top, a large group on the other side, a small group on the right, a very small group on the left, and a few individuals I talk to privately but do not share group chats with. More details to come on what those clusters are.
Some metrics
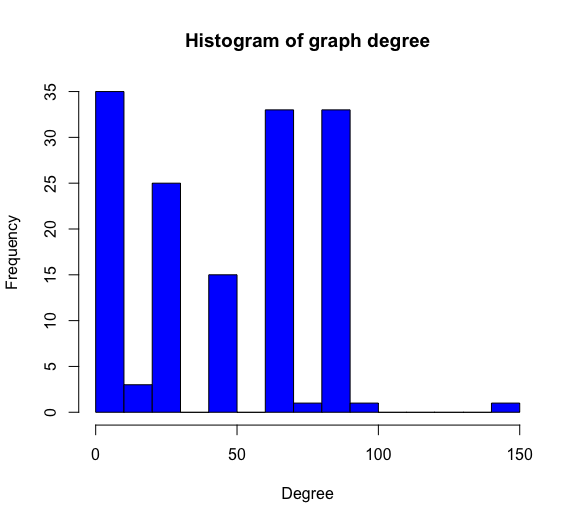
Degree centrality
| Min. | 1st Qu. | Median | Mean | 3rd Qu. | Max. |
|---|---|---|---|---|---|
| 1 | 15 | 49 | 46.57 | 70.00 | 146.00 |
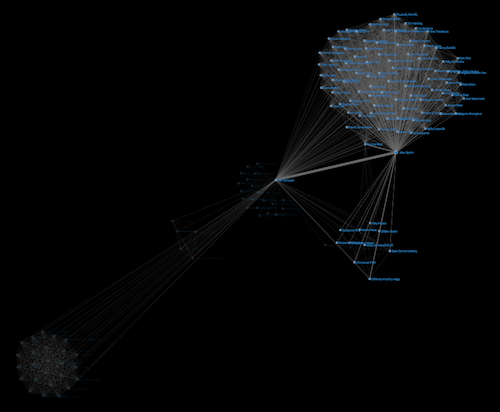
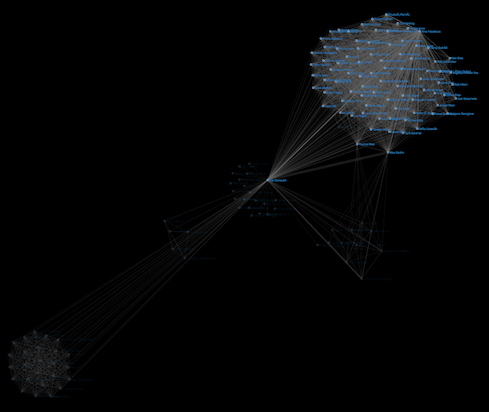
Degree here means how many people one person is connected to in my personal Messenger network. 146 is obviously myself. The isolated friends, my personal friends who are not part of any group, have a degree of 1. Half of my friends are connected to 49+ people via group chats and the average number of people they are connected to in my personal communication network is 46.57.
We can see who has high and low degree by plotting the network and weighting the vertice size by the size of their degree. It splits the big university group into 3: friends of friends on the left, close friends in the middle, coursemates on the right.
 ****
****
Other centrality measures
| Centrality measure | Min | Median | Mean | Max |
|---|---|---|---|---|
| Eigenvector | 0.009 | 0.21 | 0.23 | 1.00 |
| Betweeness | 0.00 | 19.16 | 78.51 | 5923 |
| Closeness | 0.00 | 0.00 | 0.00 | 0.00 |
Eigenvector centrality captures the number of connections a node has and how important those connections are. The people with the smallest eigenvector are therefore my friends who are in no conversations besides our private chat whereas people with high eigenvector are the ones part of the clusters: they have many connections via group chats, and the people they are connected to themselves are very well connected.
Betweeness centrality tells us to what extent each node serves as point of entry connecting other nodes. Again, I have by far the highest betweeness because I connect everyone, followed by my boyfriend who indeed connects a large part of my friends. Isolated friends and fencing club all have very low betweeness centrality.
Closeness measures how close each node is to every other, so essentially how close or how far someone in the network is to another person. It is very low because I am connected to everyone, meaning that anyone can get to anyone else simple by going via me, and for some people (those who are directly connected), that would already be the longest path!
Transitivity
The transitivity is 0.88, which means that 88% of triads are closed. In other words: if friend A and friend B are in a group chat together and friend A and friend C are in a group chat together, the probability that friend B and friend C are in a group chat together is 0.88.
Structure of the network
The edges with the highest weight is (Alix, Max) where w = 17, meaning that besides our private chat, we are in 16 group chats together. The other things we can see is that we have a lot of friends in common: on hover over a vertice, the opacity of the vertices that don’t share an edge with the selected vertice is very low, so we can see that Max is in group chats with most of my friends (and almost all of my university friends).
This big group on the top consists of my university friends. Some people - my best friends - stand out with thicker edges between them and me, and between them too. Two people stand out at the bottom right of this cluster - the two people I am closest to in real life.
The first plot I made of this network confused me a lot because of this group: I didn’t recognize the names and didn’t get how I could have a group completely disconnected from the rest. After taking a close look at the name I realised it was the UCL Fencing club. Fencing is segregated into weapons and gender so I didn’t recognize many of those name but also a bit sad to see I never integrated fencing club with my social life.
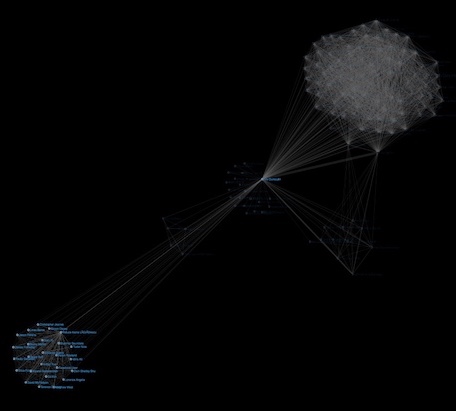
A last group to highlight is this odd little cluster: the members they are connected to my two closest friends as they but not to anyone else. This is the project Talos that I was involved with for two years with other UCL students from another department and my close friend and boyfriend. Here again, clear failure in integrating Fencing club members with the rest of my friends.
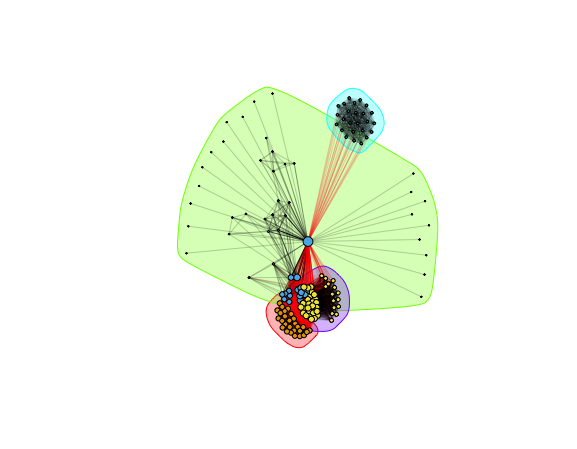
Community detection
I played around with community detection algorithms too and show the results of the fast greedy algorithm. Although the plots shown above made it quite clear what each cluster is, there was still one susprise. We can clearly see the fencing group, the Talos group, the ‘isolated’ friends, but also an interesting split in the university group. One side happens to be my PPE coursemates, while the other side is made of other friends, mostly from Economics BSc, some of them I am close to and others who are friends of friends.
Next steps
I know there is much more to explore - this might come in a next post. In particular, there are two enhancements I would like to do. The first is to add some attributes to the vertices: it is difficult to add any demographics except by doing it manually, but more interestingly, I could use the text from those conversations and extract the topics most mentioned for each connection as well as sentiment or other text features. The other improvement is to see how this network evolved. This only captures a few weeks of communication in 2018 but I have been on Facebook since 2013: the next step is to include all my data and to visualise the network changing over time: this would give me very intersting insights into my friendships, my capacity to maintain relationships and to connect people.